Population by State Banner
 
Home - Privacy - Contact

Trends for population growth and races for the different states within the USA.

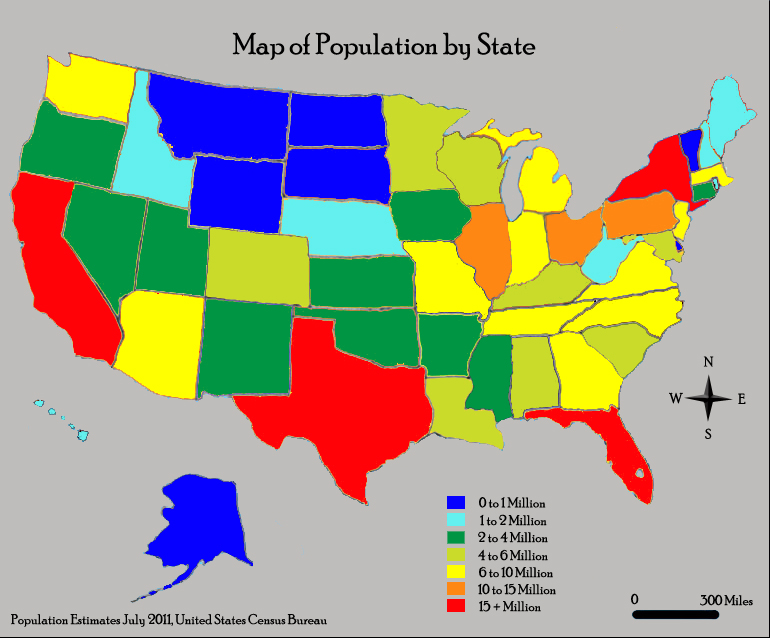
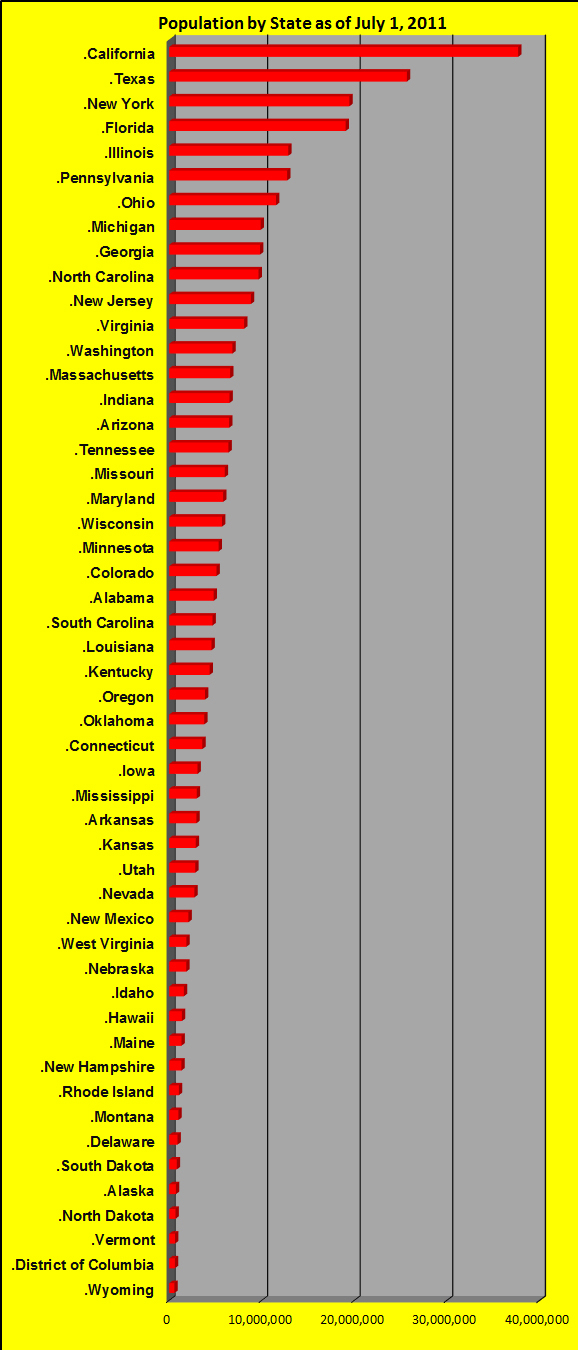
Population within the United States has been growing at various rates for different time periods depending on the particular state for a variety of reasons. Listed below is a population map and bar chart for July 1, 2011. The chart below shows the population for each state as of July 1, 2000 and July 1, 2011 for comparisons of growth for the different states. The state with the largest population is California, however over that 11 year time period Texas experienced the greatest growth in shear numbers of people living in the United States with a growth of 4,728,718 persons. By clicking on the state you will find a graphs showing trends of population growth and the United States for the years from 2000 to 2012.

United States Map for Horse Racing Tracks Washington Population 6,830,038 Idaho Population 1,584,985 Oregon Population 3,871,859 California Population 37,691,912 Arizona Population 6,482,505 New Mexico Population 2,082,224 Nevada Population 2,723,322 Wyoming Population 568,158 Colorado Population 5,116,796 Utah Population 2,817,222 Montana Population 998,199 North Dakota Population 683,932 South Dakota Population 824,082 Nebraska Population 1,842,641 Kansas Population 2,871,238 Oklahoma Population 3,791,508 Arkansas Population 2,937,979 Texas Population 25,674,681 Louisiana Population 4,574,836 Missouri Population 6,010,688 Iowa Population 3,062,309 Minnesota Population 5,344,861 Wisconsin Population 5,711,767 Illinois Population 12,869,257 Michigan Population 9,876,187 Michigan Population 9,876,187 Indiana Population 6,516,922 Ohio Population 11,544,951 Kentucky Population 4,369,356 Tennessee Population 6,403,353 Mississippi Population 2,978,512 Alabama Population 4,802,740 Georgia Population 9,815,210 North Carolina Population 9,656,401 South Carolina Population 4,679,230 Virginia Population 8,096,604 Florida Population 19,057,542 West Virginia Population 1,855,364 Hawaii Population 1,374,810 Alaska Polulation 722,718 Pennsylvania Population 12,742,886 Maryland Population 5,828,289 Delaware New Jersey Population 8,821,155 New York Population 19,465,197 Vermont Population 626,431 New Hampshire Population 1,318,194 Massachusetts Population 6,587,536 Rhode Island Population 1,051,302 Connecticut Population 3,580,709 Maine Population 1,328,188

State populations for years 2000, 2011 and 2018, in alphabetical order. Percentage growth is shown to the right.

Population by State from July 1, 2000 to July 1, 2011 to July 1, 2018
State
Population
July 1, 2000
Population
July 1, 2011
Growth from 2000 - 2011
% Growth from 2000 - 2011
Population July 1, 2018
Growth from 2011 - 2018
% Growth from 2011 - 2018
United States
282,171,957
311,591,917
29,419,960
10.43
327,167,434
15,575,517
5.00
. Alabama
4,451,849
4,802,740
350,891
7.88
4,887,871
85,131
1.77
. Alaska
627,499
722,718
95,219
15.17
737,438
14,720
2.04
. Arizona
5,166,697
6,482,505
1,315,808
25.47
7,171,646
689,141
10.63
. Arkansas
2,678,288
2,937,979
259,691
9.70
3,013,825
75,846
2.58
. California
33,994,571
37,691,912
3,697,341
10.88
39,557,045
1,865,133
4.95
. Colorado
4,328,070
5,116,796
788,726
18.22
5,695,564
578,768
11.31
. Connecticut
3,411,726
3,580,709
168,983
4.95
3,572,665
-8,044
-0.22
. Delaware
786,411
907,135
120,724
15.35
967,171
60,036
6.62
. District of Columbia
571,744
617,996
46,252
8.09
702,455
84,459
13.67
. Florida
16,047,118
19,057,542
3,010,424
18.76
21,299,325
2,241,783
11.76
. Georgia
8,230,161
9,815,210
1,585,049
19.26
10,519,475
704,265
7.18
. Hawaii
1,211,566
1,374,810
163,244
13.47
1,420,491
45,681
3.32
. Idaho
1,299,551
1,584,985
285,434
21.96
1,754,208
169,223
10.68
. Illinois
12,437,645
12,869,257
431,612
3.47
12,741,080
-128,177
-1.00
. Indiana
6,091,649
6,516,922
425,273
6.98
6,691,878
174,956
2.68
. Iowa
2,928,184
3,062,309
134,125
4.58
3,156,145
93,836
3.06
. Kansas
2,692,810
2,871,238
178,428
6.63
2,911,505
40,267
1.40
. Kentucky
4,048,903
4,369,356
320,453
7.91
4,468,402
99,046
2.27
. Louisiana
4,468,979
4,574,836
105,857
2.37
4,659,978
85,142
1.86
. Maine
1,277,211
1,328,188
50,977
3.99
1,338,404
10,216
0.77
. Maryland
5,310,579
5,828,289
517,710
9.75
6,042,718
214,429
3.68
. Massachusetts
6,363,015
6,587,536
224,521
3.53
6,902,149
314,613
4.78
. Michigan
9,955,308
9,876,187
-79,121
-0.79
9,995,915
119,728
1.21
. Minnesota
4,933,958
5,344,861
410,903
8.33
5,611,179
266,318
4.98
. Mississippi
2,848,310
2,978,512
130,202
4.57
2,986,530
8,018
0.27
. Missouri
5,606,065
6,010,688
404,623
7.22
6,126,452
115,764
1.93
. Montana
903,293
998,199
94,906
10.51
1,062,305
64,106
6.42
. Nebraska
1,713,345
1,842,641
129,296
7.55
1,929,268
86,627
4.70
. Nevada
2,018,211
2,723,322
705,111
34.94
3,034,392
311,070
11.42
. New Hampshire
1,240,446
1,318,194
77,748
6.27
1,356,458
38,264
2.90
. New Jersey
8,430,921
8,821,155
390,234
4.63
8,908,520
87,365
0.99
. New Mexico
1,820,813
2,082,224
261,411
14.36
2,095,428
13,204
0.63
. New York
18,998,044
19,465,197
467,153
2.46
19,542,209
77,012
0.40
. North Carolina
8,079,383
9,656,401
1,577,018
19.52
10,383,620
727,219
7.53
. North Dakota
641,200
683,932
42,732
6.66
760,077
76,145
11.13
. Ohio
11,363,844
11,544,951
181,107
1.59
11,689,442
144,491
1.25
. Oklahoma
3,453,943
3,791,508
337,565
9.77
3,943,079
151,571
4.00
. Oregon
3,430,891
3,871,859
440,968
12.85
4,190,713
318,854
8.24
. Pennsylvania
12,285,504
12,742,886
457,382
3.72
12,807,060
64,174
0.50
. Rhode Island
1,050,736
1,051,302
566
0.05
1,057,315
6,013
0.57
. South Carolina
4,023,570
4,679,230
655,660
16.30
5,084,127
404,897
8.65
. South Dakota
755,694
824,082
68,388
9.05
882,235
58,153
7.06
. Tennessee
5,703,243
6,403,353
700,110
12.28
6,770,010
366,657
5.73
. Texas
20,945,963
25,674,681
4,728,718
22.58
28,701,845
3,027,164
11.79
. Utah
2,244,314
2,817,222
572,908
25.53
3,161,105
343,883
12.21
. Vermont
609,903
626,431
16,528
2.71
626,299
-132
-0.02
. Virginia
7,104,533
8,096,604
992,071
13.96
8,517,685
421,081
5.20
. Washington
5,911,122
6,830,038
918,916
15.55
7,535,591
705,553
10.33
. West Virginia
1,806,962
1,855,364
48,402
2.68
1,805,832
-49,532
-2.67
. Wisconsin
5,374,254
5,711,767
337,513
6.28
5,813,568
101,801
1.78
. Wyoming
493,958
568,158
74,200
15.02
577,737
9,579
1.69


The bar chart of states represents the order of greatest to least populated states. The chart also shows how close New York and Florida are for being the state with the 3rd largest population.

Population Bar Chart for Different States in the USA

You can respond to the United States 2020 census either by mail, online or by phone.

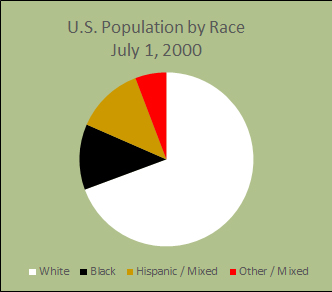
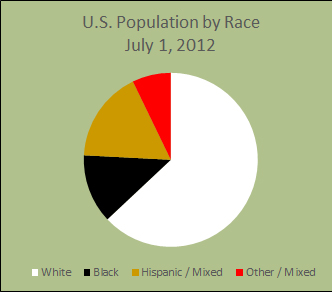
The race percentages for United States has changed some from 2000 to 2012. The percentage of the white only population has decreased from 69.4 to 63.0. The percent of the black only population has only slightly increased from 12.2 to 12.8. The percent of population of hispanics has increased from 12.6% to 17.0% and other/mixed races have increased from 5.8% to 7.2%.

Population by Race for the United States
Race
July 1, 2000
% of Total
July 1, 2012
% of Total
White
195,701,752
69.4
202,988,134
63.0
Black
34,405,800
12.2
41,312,371
12.8
Hispanic / Mixed
35,661,885
12.6
54,746,061
17.0
Other / Mixed
16,392,974
5.8
23,120,578
7.2
Total Races & Hispanic*
282,162,411**
322,167,144**


*Hispanics are technically not considered a race but rather an ethnicity.
**Note the slight difference of the population used in the race chart from population chart above. Totals were estimates from U.S. Census bureau and they had the discrepancy.

United States population by race for 2000
 

References:

Population Estimates, 2013, United States Census Bureau, http://www.census.gov/popest/data/historical/2010s/index.html

List of U.S. states and territories by population, 2013, Wikipedia The Free Encyclopedia, http://en.wikipedia.org/wiki/List_of_U.S._states_and_territories_by_population

Home - Privacy - Contact

Copyright © 2013-2022 populationbystate.com. All Rights Reserved.