
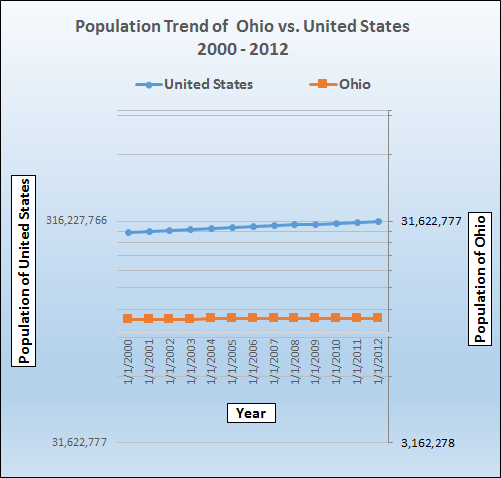
Population of Ohio and the United States Annually from 2000 to 2012 |
|||||||||||||
Territory |
7/1/2012 |
7/1/2011 |
7/1/2010 |
7/1/2009 |
7/1/2008 |
7/1/2007 |
7/1/2006 |
7/1/2005 |
7/1/2004 |
7/1/2003 |
7/1/2002 |
7/1/2001 |
7/1/2000 |
United States |
313,914,040 |
311,591,917 |
309,330,219 |
307,006,550 |
304,374,846 |
301,579,895 |
298,593,212 |
295,753,151 |
293,045,739 |
290,326,418 |
287,803,914 |
285,081,556 |
282,171,957 |
Ohio |
11,544,225 |
11,544,951 |
11,537,968 |
11,542,645 |
11,528,072 |
11,520,815 |
11,492,495 |
11,475,262 |
11,464,593 |
11,445,180 |
11,420,981 |
11,396,874 |
11,363,844 |
Annual Estimates and data of the Resident Population for the United States and States: April 1, 2000 to July 1, 2009 (NST-EST2009-01)
Source: U.S. Census Bureau, Population Division
Release Date: December 2009
Annual Estimates of the Population for the United States and States: April 1, 2010 to July 1, 2011 (NST-EST2011-01)
Source: U.S. Census Bureau, Population Division
Release Date: December 2011
References:
Population Estimates, 2013, United States Census Bureau, http://www.census.gov/popest/data/historical/2010s/index.html
List of U.S. states and territories by population, 2013, Wikipedia The Free Encyclopedia, http://en.wikipedia.org/wiki/List_of_U.S._states_and_territories_by_population